Choose the pair
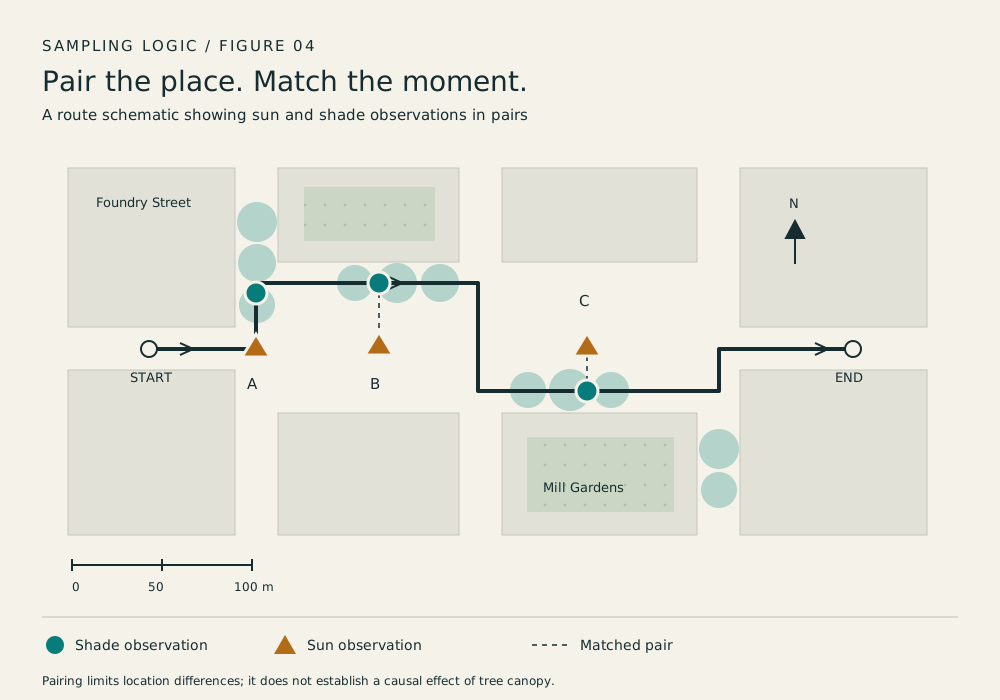
Select one shaded and one open point within 30 metres. Record paving, building height and visible canopy cover.
Field protocol
Paired air readings, recorded at walking height. The same field protocol across six routes in Merewick.
Read the findingsThe question
We compared air temperature at nearby shaded and open-sky points, while keeping the route, time window and sensor height consistent.
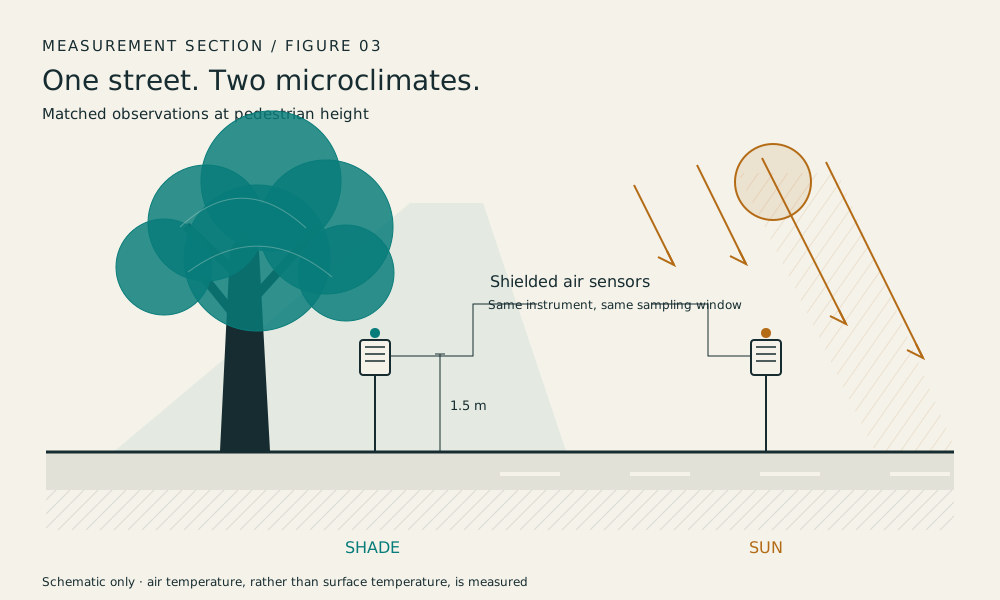
We measured air temperature, not surface temperature. The two answer different questions.
Repeatable steps
Select one shaded and one open point within 30 metres. Record paving, building height and visible canopy cover.
Place a shielded air sensor at 1.5 metres. Wait five minutes before logging. Avoid contact with walls, bodies and hot surfaces.
Visit every pair at 10:00, 13:00 and 16:00. Alternate the route direction between days to reduce order effects.
Calculate sun-minus-shade differences for each pair, then summarise by time window. Never treat repeated readings as independent sites.
Instruments & timing
From notebook to figure
Each observation retained its route, time, sky condition and surface notes. Incomplete pairs were excluded from paired differences. No missing readings were imputed.
Inspect the sample dataset ↗The evidence, in view
Read the observations alongside the method, uncertainty and limits.